The Difference Between a "Cleaned" and a "Clean" Heat Exchanger
The HeatHamster team breaks down real customer cases where real-time data analysis made the difference between “cleaned” and “clean”.
Fouling is the primary cause of efficiency loss in industrial heat exchangers. The internal build-up of debris and contaminants limits the flow and reduces its ability to transfer heat. With regular cleaning, a heat exchanger can retain most of its efficiency.
But is a cleaned heat exchanger truly clean? HeatHamster’s unique real-time monitoring and analysis uncovers the truth.
Staying ahead of the curve with predictive maintenance
HeatHamster’s real-time data analysis enables users to time their clean-up and maintenance activities to actual needs instead of intervals. Predictive energy loss modeling helps identify the right moment for a clean-up and indicate whether it’s time for a light- or complete clean-up. This is known as predictive maintenance.

Figure 1. Predicted energy loss (blue line) vs. actual energy loss (orange line) as generated by HeatHamster analysis.
The difference between “cleaned “and “clean”
To determine the economic impact of different cleaning methods, we performed and analyzed two clean-up sessions on a set of heat exchangers.

Figure 2. On the left heat exchanger plate with fouling before cleaning, on the right heat exchanger plate with fouling after 1st light cleaning.
In the first session, we entirely replaced the heat exchanger plates on both heat exchangers. This produces similar effects achieved by performing a full chemical cleaning at correct temperatures. Therefore, this is considered a complete clean-up.
In the second session, we performed the clean-up by removing the plates and pressure-washing them to remove any built-up debris. This is considered a light clean-up.
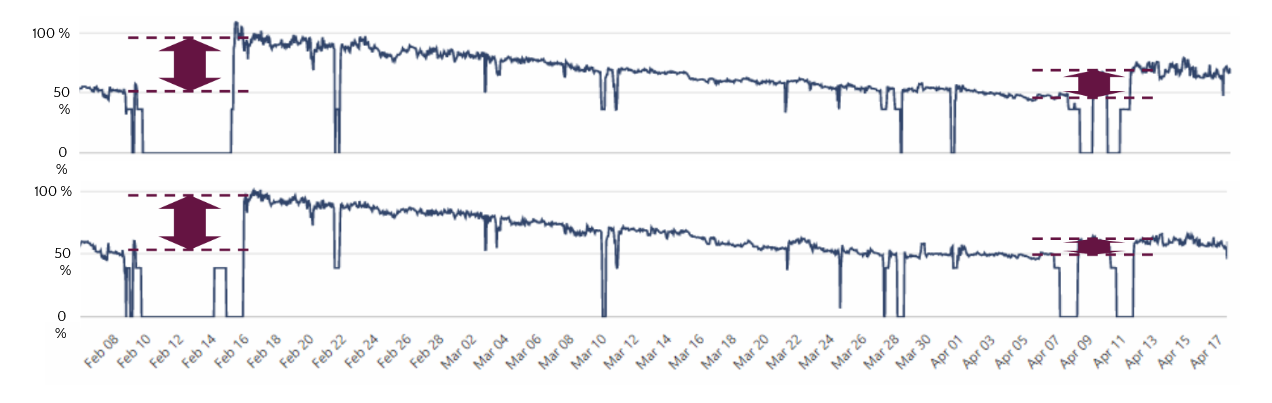
Figure 3. Efficiency-% of heat exchangers during the cleaning period.
The analysis of both methods showed a significant difference in the impact on heat exchanger efficiency. The complete clean-up resulted in a 46% increase, whereas the light clean-up only yielded a 14% increase in the efficiency-%.
When “cleaned” is not enough
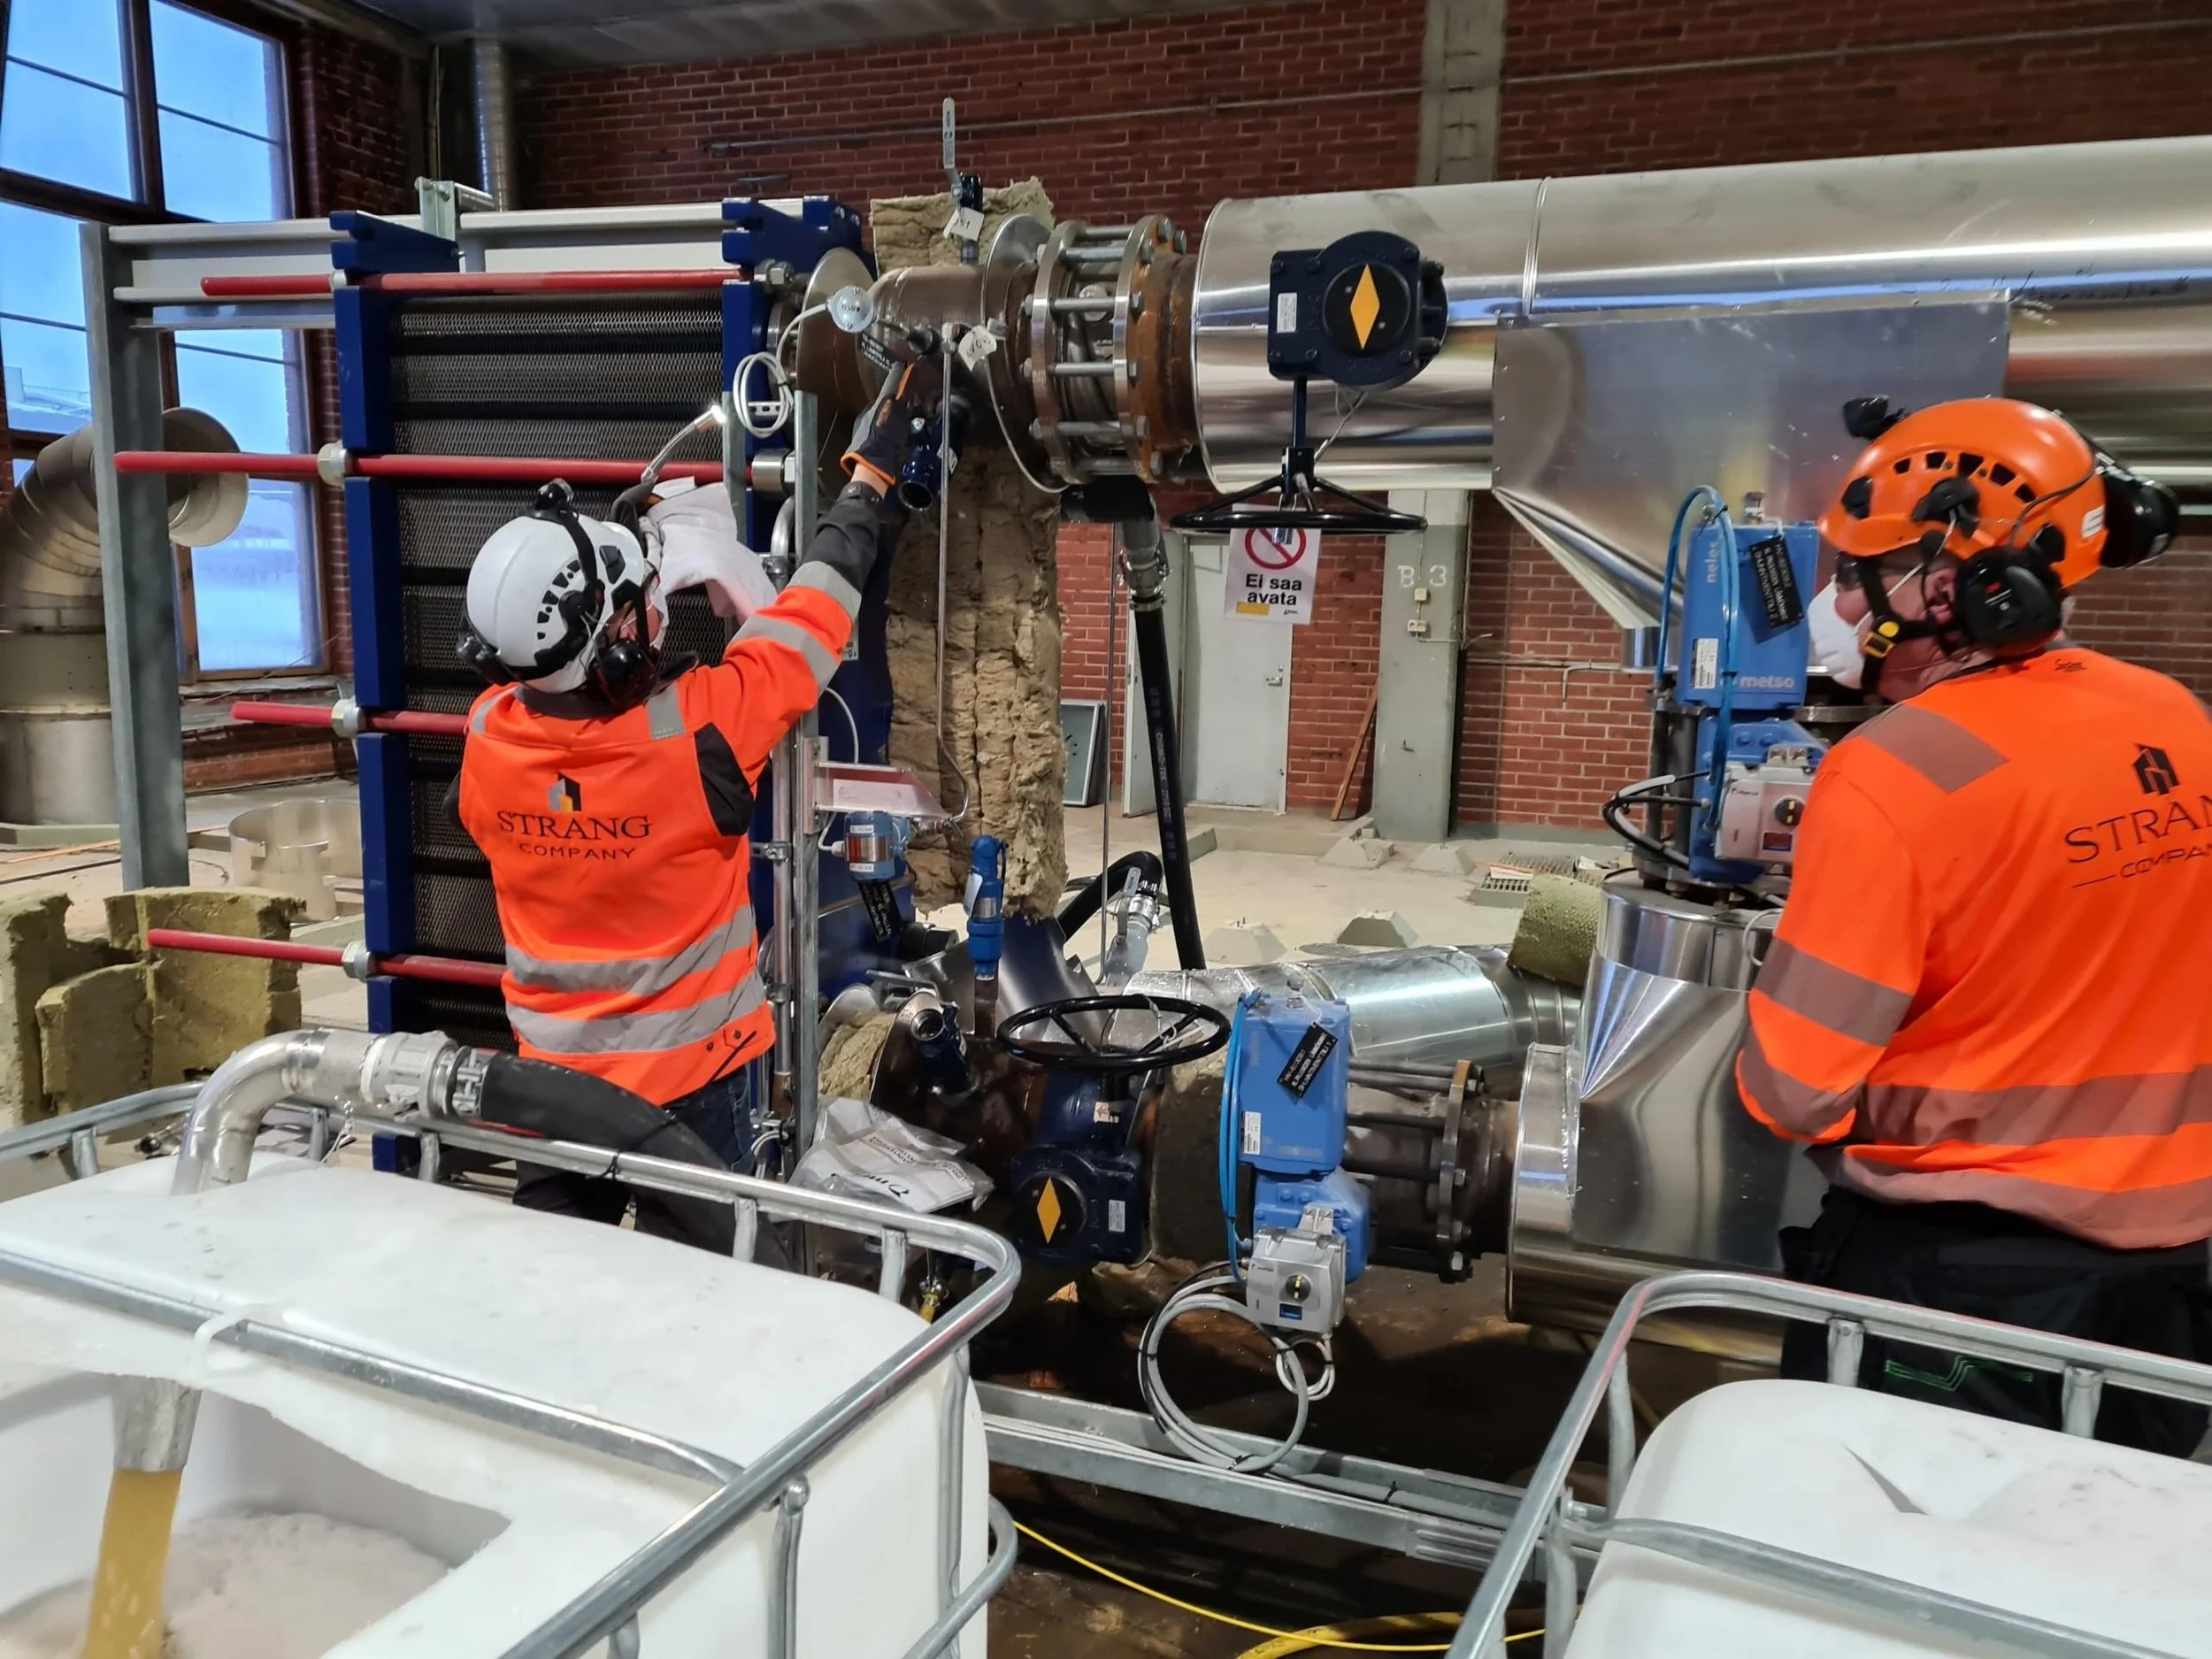
In another case, we analyzed two 7 MW heat exchangers in a wastewater circulation circuit. These are typically cleaned 1-3 times a year. The cleaning methods alternated between CIP-cleaning without dismantling and high-pressure washing after dismantling the heat exchanger.
After a series of clean-ups, the power had increased from 1.5 MW to 2.5 MW. Achieving only 2.5 MW out of the rated 7 MW raised questions on the probable cause.
HeatHamster data and images taken during cleaning indicated that hardened dirt sediments remained in the system despite the cleaning.
After taking a sample from the heat exchangers, our cleaning partner designed a cleaning formula from a combination of chemicals, temperatures, and circulation times. After applying the new formula during CIP-cleaning, the hardened sediment had softened and started to move. HeatHamster data confirmed this, but the data indicated that the power rating dropped to 2.5 MW again shortly after.
This prompted the team to immediately dismantle the heat exchanger after the CIP-cleaning to perform a high-pressure wash. By doing so, they were able to remove years of hardened sediment for the first time.
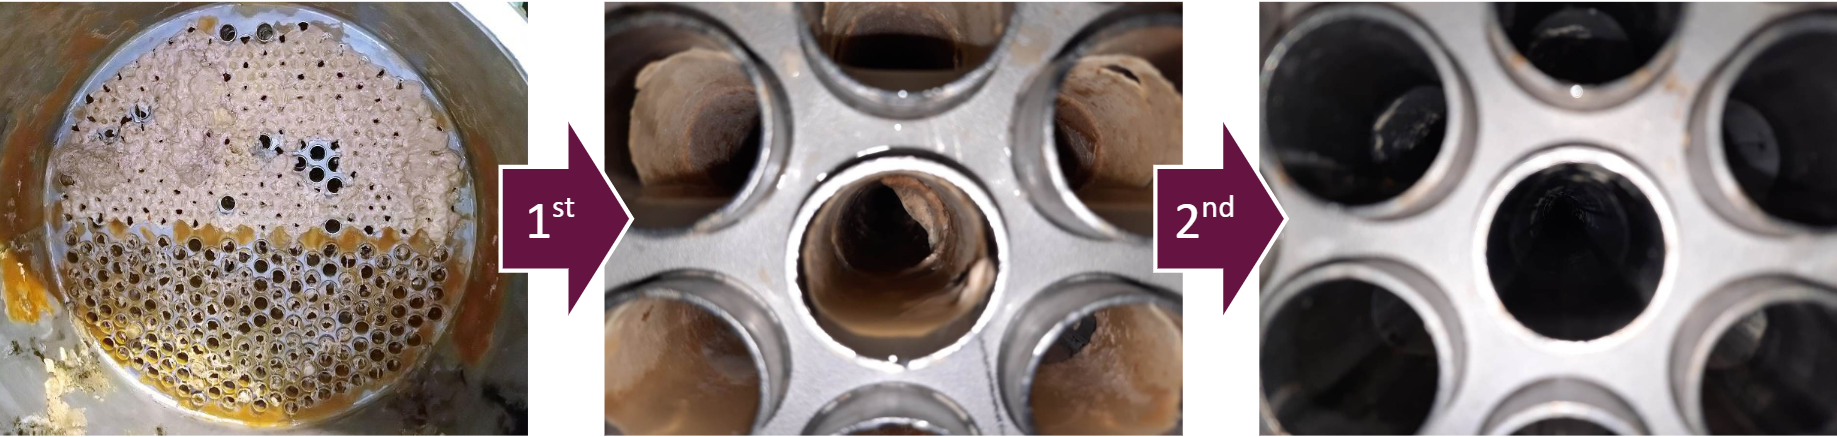
Figure 4. The progression of fouling removal with each successive cleaning.
Clean and ‘cleaned’ has a difference of 3 360 € / day
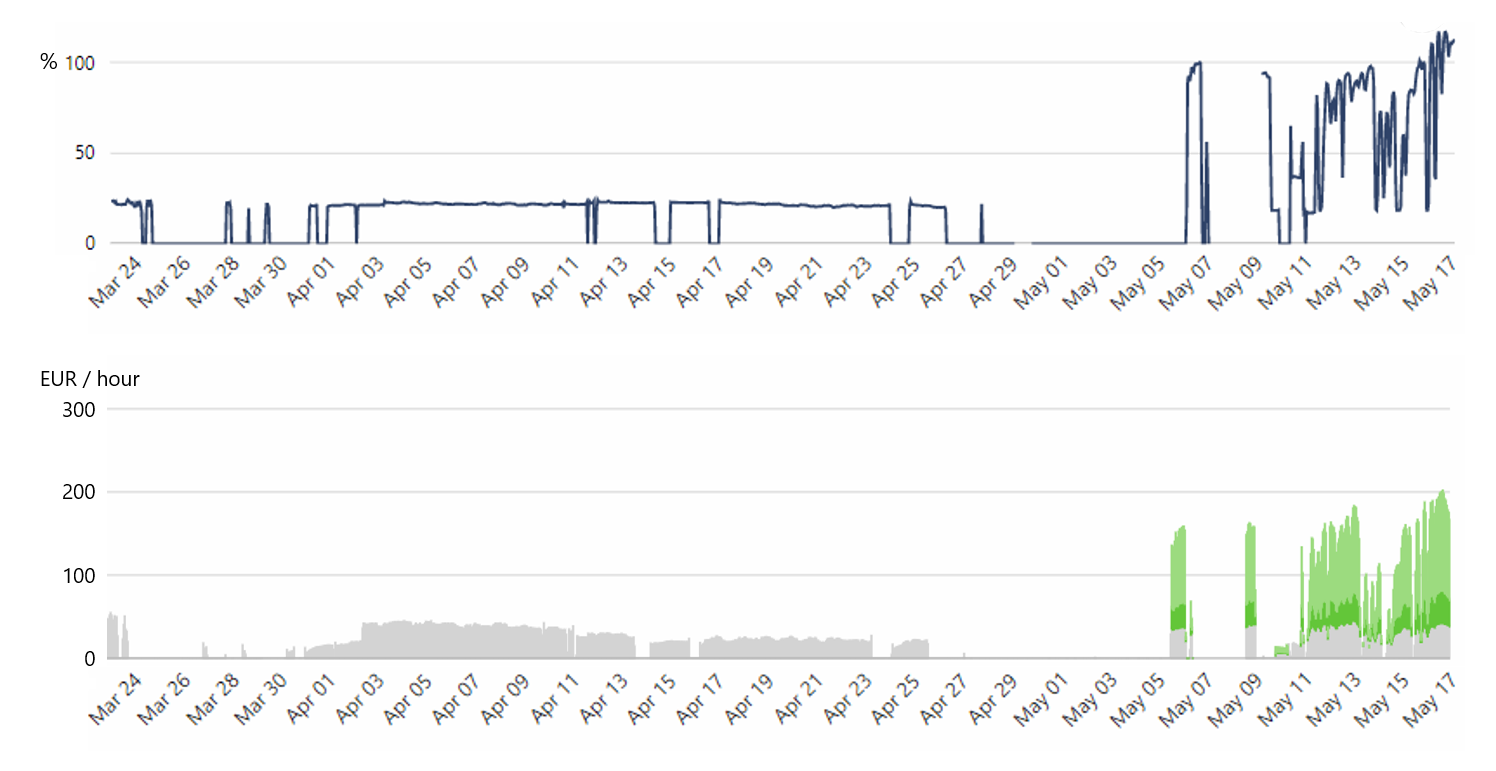
Figure 5. Efficiency-% and energy yield before and after. Green: increased energy profits. Dark Green: increased energy yield with traditional clean-ups.
We determined the heat exchangers were finally clean based on their efficiency-%. The larger heat exchanger efficiency increased from 22% to 113%. The smaller heat exchanger increased from 81% to 158%.
The power output of the 7 MW heat exchanger increased from 1.5 MW to 8.1 MW. A massive increase compared to the previous maximum of 2.5 MW.
The power increase of 6.6 MW equals a total of 3,960€ of profit savings per day. The profitability difference between the old and the new intelligent cleaning method is 3,360€ per day.
HeatHamster’s real-time monitoring will ensure that future CIP-cleanings are performed before the dirt hardens.
Million-scale benefits through a turn-key service
We calculated that this particular plant would achieve 2.6 M€ in profit savings yearly, if all heat exchangers would be optimized. Across the entire group the profit estimate is 30.8 M€ a year.
HeatHamster provides energy profits as a service. It is the world’s only turn-key service for predictive clean-up planning. Optimizing the energy profitability is based on real-time data analysis.
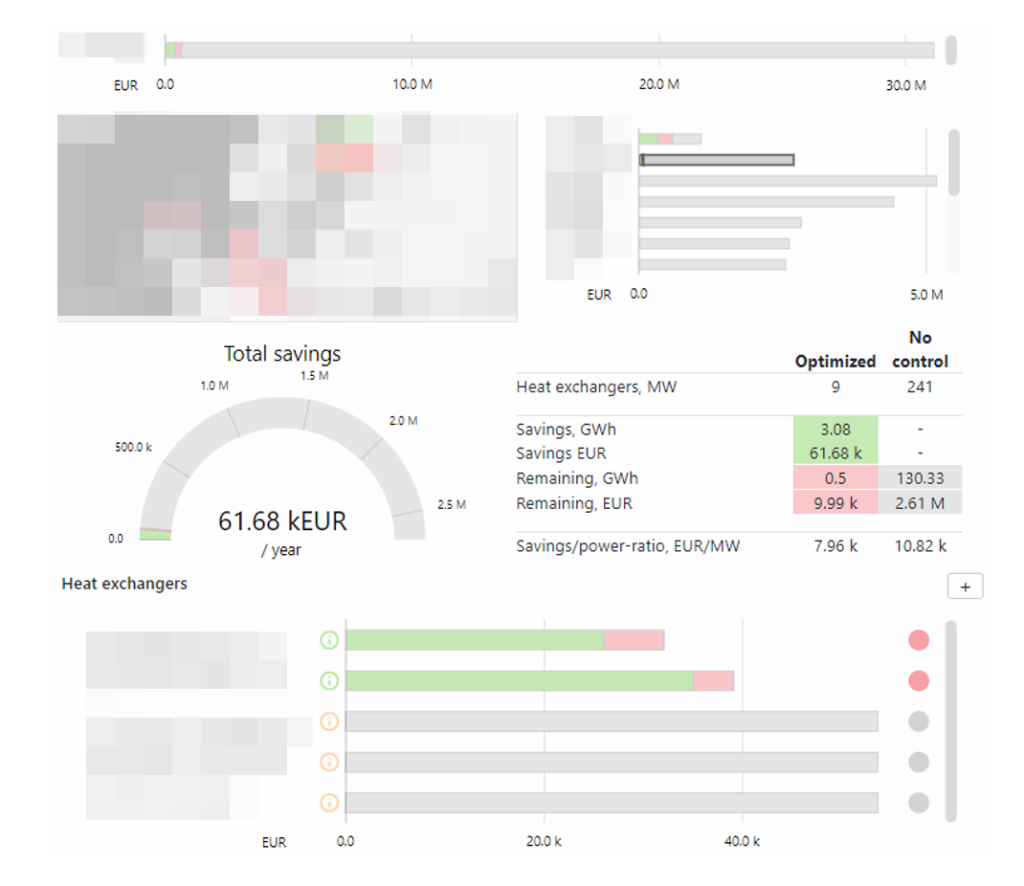
Figure 6. Total profit potential calculated with the HeatHamster service.